• Skip to primary navigation
  • Skip to main content
  • Skip to primary sidebar
  • Skip to footer
Knowland

Knowland

  • Solutions
    • Hotel Properties
      • Knowland Classic
      • Knowland Select
    • Above Property Management
      • Portfolio Capture
      • Market Analytics
    • CVBs and DMOs
    • Features & Pricing
  • Resources
    • Hospitality Group & Business Performance Index
    • Success Stories
    • White Papers & Datasheets
    • Webcasts & Events
    • Blog
    • Sales Calculator
    • Glossary
  • Customers
    • Customer Sign In >
    • Support & Training
    • Billing Inquiries >
  • About Us
    • Meet Knowland
    • Culture
    • Job Openings
    • Press & Media
    • Sustainability
    • Contact Us
  • Support
  • Sign In
  • Try for Free
  • Request a Demo
  • Support
  • Sign In >
TRY FOR FREE REQUEST DEMO

Weekly Group Business Trends, Week Ending April 23, 2022

April 27, 2022

Event activity rebounds from the Holiday

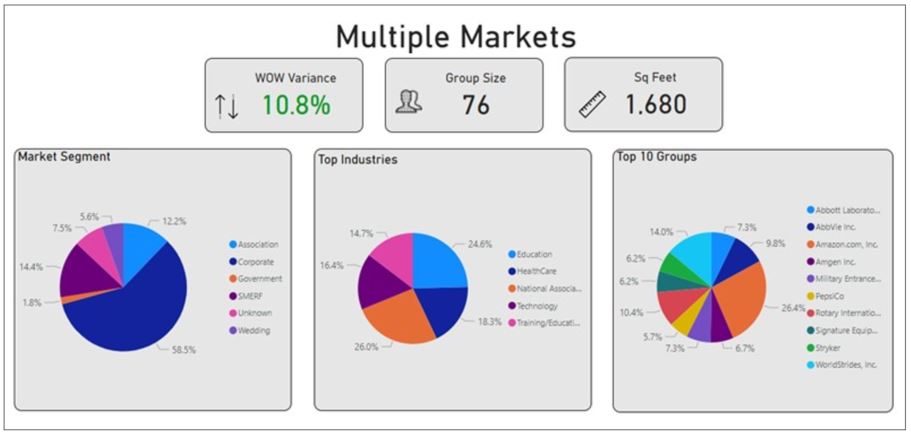
After a decline due to the Easter weekend, the US market rebounded as anticipated. Meetings and events increased by 10.8% compared to the prior week. The next few weeks should continue to see comparable growth as we move farther from the holiday. Average meeting metrics increased slightly from the prior week but are in line with averages from prior years. The average number of attendees for the week was 76 people, while the average square footage used was 1,680 per event.

April 23 2022 Weekly Data

The corporate market segment represented 58.5% of overall business for the week. National Association, Education, Healthcare, Technology, and Training/Education were the top industry segments.

Markets with the highest week over week growth were Chicago, Charlotte, Orlando, Denver, and San Diego. The average growth for these markets was 48% week over week.

Market Average Attendees Average Square Footage Used
Chicago, IL 70 1,571
Charlotte, NC-SC 89 1,872
Orlando, FL 100 2,040
Denver, CO 79 1,614
San Diego, CA 72 2,065

Orlando, FL, and Denver, CO had the lowest space to attendee ratio while San Diego, CA had the highest. These numbers evolve every week but are in line with trends of markets at different stages of recovery.

Knowland tracks the weekly event activity across 108 markets across the United States.

Ready to see what is happening in your market today? Schedule a free market analysis to find out.

Category iconHot Data Trends Tag iconWeekly Group Business Trends

Primary Sidebar

Footer

  • Solutions
    • Hotel Properties
    •   – Knowland Classic
    •   – Knowland Select
    • Above Property Management
    •   – Portfolio Capture
    •   – Market Analytics
    • CVBs and DMOs
    • Features & Pricing
    • Try for Free >
    • Demo Request >
  • Resources
    • Hospitality Group & Business Performance Index
    • Success Stories
    • White Papers & Datasheets
    • Webcasts & Events
    • Blog
    • Sales Calculator
    • Glossary
  • Customers
    • Customer Sign In >
    • Support & Training
    • Billing Inquiries >
  • About Us
    • Meet Knowland
    • Culture
    • Job Openings
    • Press & Media
    • Sustainability
    • Contact Us >

[email protected]

[email protected]

202-312-5880

2300 Wilson Blvd. Ste 700 Arlington, VA 22201

Subscribe for news and updates

© 2004–2025 Knowland Group

Privacy Policy

Cookie Settings