• Skip to primary navigation
  • Skip to main content
  • Skip to footer
Knowland

Knowland

  • Solutions
    • Hotel Properties
    • Above Property Management
      • Portfolio Capture
      • Market Analytics
    • Convention Centers and Other Venues
    • Features & Pricing
  • Resources
    • Meetings Recovery Forecast
    • Success Stories
    • White Papers & Datasheets
    • Webcasts & Events
    • Blog
    • Sales Calculator
    • Glossary
  • Customers
    • Customer Sign In >
    • Support & Training
    • Billing Inquiries >
  • About Us
    • Meet Knowland
    • Culture
    • Job Openings
    • Press & Media
    • Sustainability
    • Contact Us
  • Support
  • Sign In
  • Try for Free
  • Request a Demo
  • Support
  • Sign In >
TRY FOR FREE REQUEST DEMO

Weekly Group Business Trends, Week Ending June 11, 2022

June 15, 2022

Event activity rebounds as summer begins

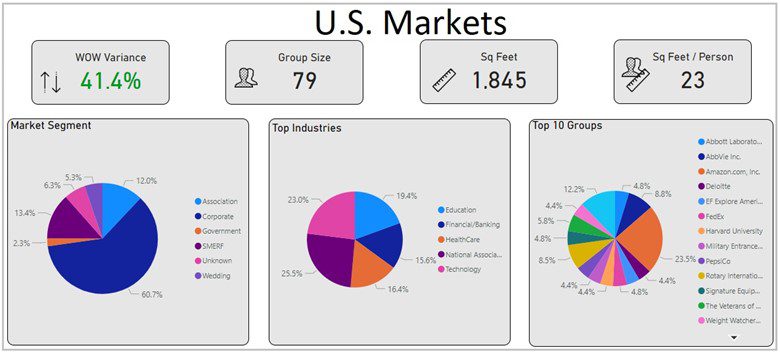
There has been a rebound after seeing a decline in the U.S. market due to Memorial Day weekend. Meetings and events increased by 41.4% compared to the prior week. The next few weeks should continue to grow as we move further away from the holiday and into the summer.

The average number of attendees for the week was 79 people, while the average square footage used was 1,845 per event.

June 11 U.S. data trends

The corporate market segment represented 60.7% of overall business for the week. National Association, Technology, Education, Healthcare, and Financial/Banking were the top industry segments

Markets with the highest week over week growth were Washington, DC, San Francisco-San Mateo, Chicago, Minneapolis-St Paul, and Boston. The average growth for these markets was 53.7% week over week.

Market Average Attendees Average Square Footage Used
Washington, DC-MD-VA 81 2,065
San Francisco – San Mateo, CA 44 853
Chicago, IL 75 1,820
Minneapolis-St Paul, MN-WI 85 1,705
Boston, MA 72 1,586

San Francisco – San Mateo, CA and Minneapolis-St Paul, MN-WI had the lowest space to attendee ratio while Washington, DC had the highest. These numbers evolve every week but are in line with trends of markets at different stages of recovery.

Knowland tracks the weekly event activity across 108 markets across the United States.

Ready to see what is happening in your market today? Schedule a free market analysis to find out.

Category iconHot Data Trends Tag iconWeekly Group Business Trends

Footer

  • Solutions
    • Hotel Properties
    • Above Property Management
    •   – Portfolio Capture
    •   – Market Analytics
    • Convention Centers and Other Venues
    • Features & Pricing
    • Try for Free >
    • Demo Request >
  • Resources
    • Meetings Recovery Forecast
    • Success Stories
    • White Papers & Datasheets
    • Webcasts & Events
    • Blog
    • Sales Calculator
    • Glossary
  • Customers
    • Customer Sign In >
    • Support & Training
    • Billing Inquiries >
  • About Us
    • Meet Knowland
    • Culture
    • Job Openings
    • Press & Media
    • Sustainability
    • Contact Us >

LinkedIn Profile Twitter Profile Facebook Profile

info@knowland.com

clientcare@knowland.com

202-312-5880

2300 Wilson Blvd. Ste 700 Arlington, VA 22201

Subscribe for news and updates

© 2004–2023 Knowland Group

Privacy Policy

Cookie Settings