• Skip to primary navigation
  • Skip to main content
  • Skip to footer
Knowland

Knowland

  • Solutions
    • Hotel Properties
    • Above Property Management
      • Portfolio Capture
      • Market Analytics
    • Convention Centers and Other Venues
    • Features & Pricing
  • Resources
    • Meetings Recovery Forecast
    • Success Stories
    • White Papers & Datasheets
    • Webcasts & Events
    • Blog
    • Glossary
  • Customers
    • Customer Sign In >
    • Support & Training
    • Billing Inquiries >
  • About Us
    • Meet Knowland
    • Culture
    • Job Openings
    • Press & Media
    • Sustainability
    • Contact Us
  • Support
  • Sign In
  • Request a Demo
  • Support
  • Sign In >
Request a Demo >

Weekly Group Business Trends, Week Ending November 26, 2022

November 29, 2022

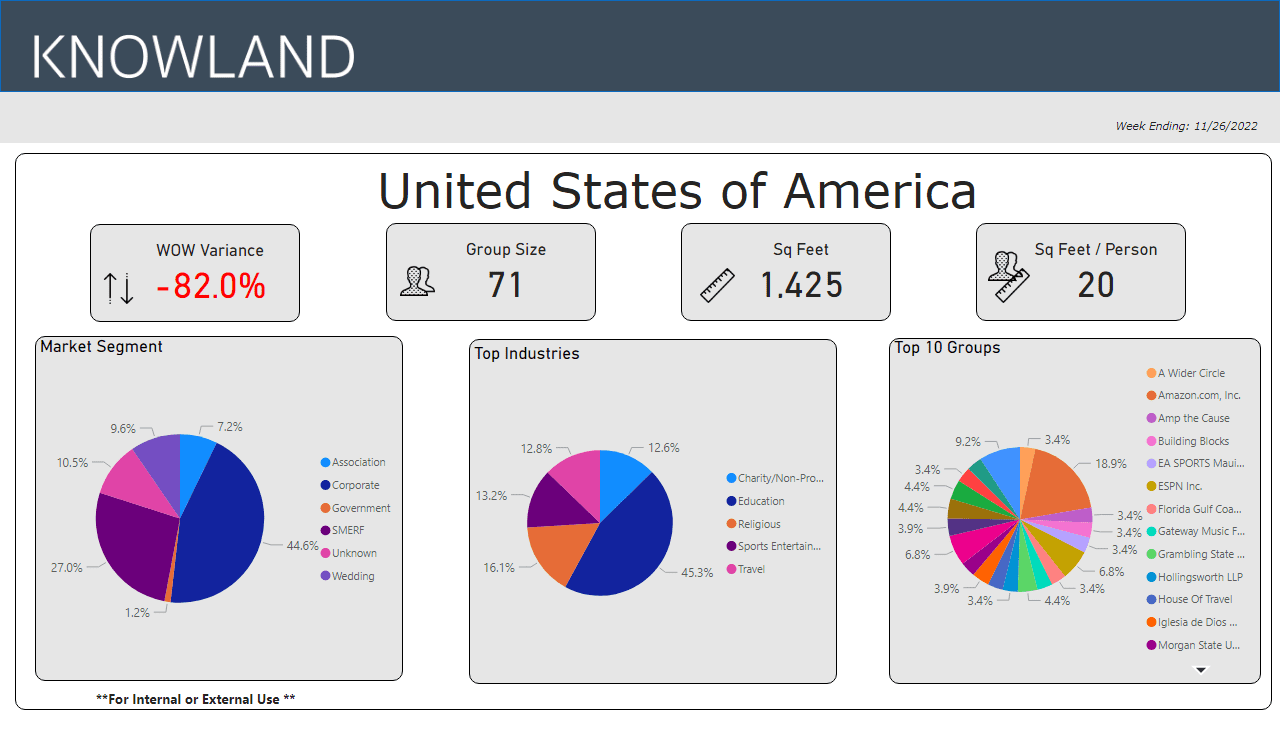
Long holiday weekend meeting activity follows seasonality trends

The number of U.S. meetings and events decreased 82.0% compared to the prior week. The slow in meeting volume growth for this week is consistent with holiday seasonality, reflecting that people are starting holiday gatherings at home with family starting early in the week and through the long weekend.

Ready to see what is happening in your market today? Schedule a free market analysis to find out.

The average number of attendees for the week was 71 (compared to 82 last week), while the average square footage used was 1425 (compared to  1,800) per event and square feet used per person was fell to 20 (compared to 22).

11-26-22 hot data

While the corporate market segment still dominated it fell to 44.6% (vs 61.6% last week) of overall meetings business for the week, while SMERF jumped to 27.%. The top five segments for the week were: Education, Religious, Sports Entertainment, Travel and Charity/Non-Profit/Social Sciences.

In this down week, we focus on the markets with the largest estimated meeting size. Top markets were Connecticut, Kansas, Maui, Rochester and Albany.

Market Average Group Size Average Sq Ft Used
Connecticut Area 2,384 59,352
Kansas 635 36,975
Maui Island, HI 636 10,307
Rochester, NY 345 14,358
Albany-Schenectady, NY 254 6,483

These numbers and markets change weekly based on market dynamics and social trends.

Knowland tracks the weekly event activity across 128 U.S. markets with more globally and is expanding coverage regularly.

Talk to a Knowland data expert today for sneak peek at your market trends.

Category iconHot Data Trends Tag iconWeekly Group Business Trends

Footer

  • Solutions
    • Hotel Properties
    • Above Property Management
    •   – Portfolio Capture
    •   – Market Analytics
    • Convention Centers and Other Venues
    • Features & Pricing
    • Demo Request >
  • Resources
    • Meetings Recovery Forecast
    • Success Stories
    • White Papers & Datasheets
    • Webcasts & Events
    • Blog
    • Glossary
  • Customers
    • Customer Sign In >
    • Support & Training
    • Billing Inquiries >
  • About Us
    • Meet Knowland
    • Culture
    • Job Openings
    • Press & Media
    • Sustainability
    • Contact Us >

LinkedIn Profile Twitter Profile Facebook Profile

info@knowland.com

clientcare@knowland.com

202-312-5880

1735 N Lynn St. Suite 600
Arlington, VA 22209

Subscribe for news and updates

© 2004–2023 Knowland Group

Privacy Policy

Cookie Settings