• Skip to primary navigation
  • Skip to main content
  • Skip to primary sidebar
  • Skip to footer
Knowland

Knowland

  • Solutions
    • Hotel Properties
      • Knowland Classic
      • Knowland Select
    • Above Property Management
      • Portfolio Capture
      • Market Analytics
    • CVBs and DMOs
    • Features & Pricing
  • Resources
    • Hospitality Group & Business Performance Index
    • Success Stories
    • White Papers & Datasheets
    • Webcasts & Events
    • Blog
    • Sales Calculator
    • Glossary
  • Customers
    • Customer Sign In >
    • Support & Training
    • Billing Inquiries >
  • About Us
    • Meet Knowland
    • Culture
    • Job Openings
    • Press & Media
    • Sustainability
    • Contact Us
  • Support
  • Sign In
  • Try for Free
  • Request a Demo
  • Support
  • Sign In >
TRY FOR FREE REQUEST DEMO

Weekly Group Meetings and Events Stats, Week Ending November 25, 2023

November 30, 2023

Corporate meeting share drops over the U.S. Thanksgiving week

For the week ending November 25, 2023, the number of U.S. meetings and events dropped compared to the prior week, due in most part to the Thanksgiving holiday. Corporate events share volume dropped from 63.8% of meetings and events to 47.0%, with Education driving the dominant industry share at 42.5% for the week, followed by the Religious segment at 15.9%, for the top five segments.

The average number of attendees for the week was 81 (compared to 83 for the previous week), while the average square footage used was 1,611 per event (compared to 1,900 for the previous week), and square feet used per person was 20.

Hot trends week of 11-25-23

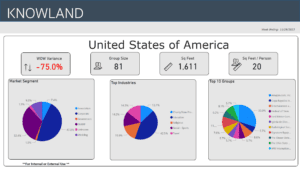
The top five segments for the week were: Education, Religious, Travel, Social – Sports, and Charity/Non-Profit/Social Services.

The full list of top growth market movers and shakers were:  Florida Central,  Alabama North, Indiana North, and Oregon Area.

Market Average Group Size Average Sq Ft Used
Florida Central 20 1,852
Alabama North 265 4,246
Indiana North 93 1,503
Oregon Area 527 17,164

These numbers and markets change weekly based on market dynamics and social trends.

Knowland tracks the weekly event activity across 166 U.S. markets with more globally and is expanding coverage regularly.

Talk to a Knowland data expert today for sneak peek at your market trends.

Category iconHot Data Trends Tag iconWeekly Group Business Trends

Primary Sidebar

Footer

  • Solutions
    • Hotel Properties
    •   – Knowland Classic
    •   – Knowland Select
    • Above Property Management
    •   – Portfolio Capture
    •   – Market Analytics
    • CVBs and DMOs
    • Features & Pricing
    • Try for Free >
    • Demo Request >
  • Resources
    • Hospitality Group & Business Performance Index
    • Success Stories
    • White Papers & Datasheets
    • Webcasts & Events
    • Blog
    • Sales Calculator
    • Glossary
  • Customers
    • Customer Sign In >
    • Support & Training
    • Billing Inquiries >
  • About Us
    • Meet Knowland
    • Culture
    • Job Openings
    • Press & Media
    • Sustainability
    • Contact Us >

[email protected]

[email protected]

202-312-5880

2300 Wilson Blvd. Ste 700 Arlington, VA 22201

Subscribe for news and updates

© 2004–2025 Knowland Group

Privacy Policy

Cookie Settings