
2019 is having a strong start with 4.8% more definite rooms are on the books, compared to this time in 2017 and across all future dates, the new bookings velocity is up 9.3% compared to the same 3-month window in 2017. Check out the full results in this month’s Pace Navigator!
On the Books Pace & New Bookings Velocity, as of November 30, 2018
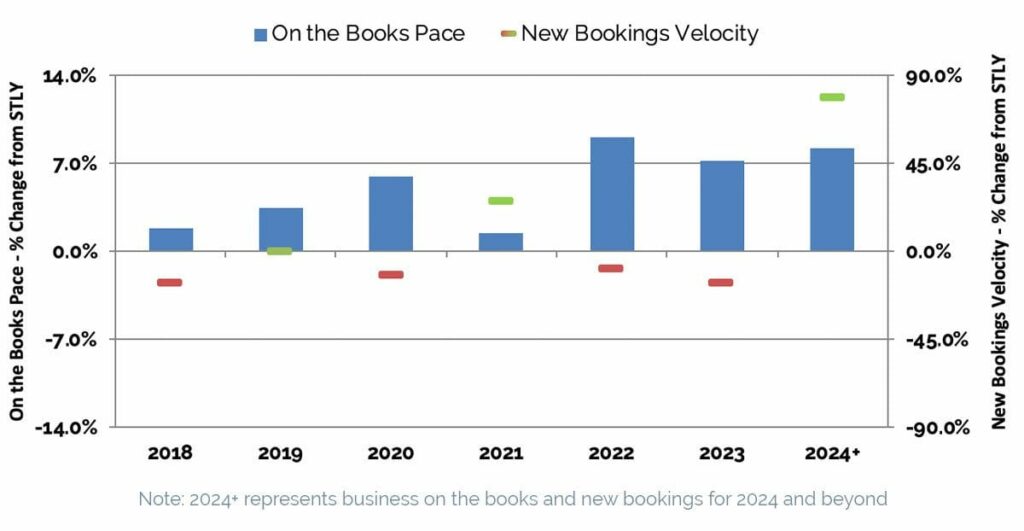
| On the Books (OTB) Pace:+4.8% |
This metric measures the change in definite room nights on the books, as of November 30, 2018, compared to what was on the books the same time last year (STLY), or November 30, 2017. Holding steady since last month, our data indicates 4.8% more definite rooms are on the books, compared to this time in 2017. The graph above shows the OTB Pace change versus same time last year, for each year in the future booking horizon.
| New Bookings Velocity:+9.3% |
This metric measures the change in room nights from newly signed bookings over the last three months, in this case September – November, compared to room nights booked over the same time last year (STLY). Across all future dates, the new bookings velocity is up 9.3% compared to the same 3-month window in 2017. The graph above shows the new bookings velocity change versus same time last year, for each year in the future booking horizon. For example, the +26% new bookings velocity for 2021 compares the total room nights from September – November 2018 new bookings for 2019 to the total room nights from September – November 2017 new bookings for 2018.
Our Take on This Month’s Data:
North American pace continues to improve, up 0.5% over last month, with only one final month of data analysis to go before we close out 2018!
In December’s edition of the Pace Navigator, we noted that 2021 pace was finally moving in the right direction. We are thrilled to report that, this month pace in 2021 is in the black. Thanks to a stout 26% booking velocity last month, 2021 is now sitting 1.5% ahead in pace, which is great news. With industry occupancy forecasts remaining relatively flat through 2021, it is even more important for group bookings to remain strong. A solid base of group business provides hotel revenue managers more opportunity to drive higher rates in the later portion of the booking cycle, particularly in the transient segment.
While we have seen positive year-over-year gains in overall booking velocity over recent months, the gains have been decelerating each month. The impact of this has been most pronounced in 2022, where on the books pace is now +9% versus same time last year, down from +11% a few months back. Booking velocity is a leading indicator of future performance expectations, so we will be watching this number closely over the coming months. This could provide some of the earliest indication of how much gas is left in the tank of this extended hotel industry growth cycle.
We hope you find this data useful as we kick off 2019. Here’s to a great year with many successes ahead!
About the Pace Navigator:
Each month, Knowland collects a significant amount of data on forward-looking group demand across 60+ major North American markets. This data is provided by Convention and Visitor Bureaus (CVBs) that participate in Knowland’s TAP Report. It is unique in providing group room nights booking pace information across the entire multi-year future booking window. This data represents over 30 million annual room nights, and represents nearly 50% of the group business conducted by hotels across these markets.

